Profiling Python Scripts
Run snake, run! How to profile python scripts with ease.
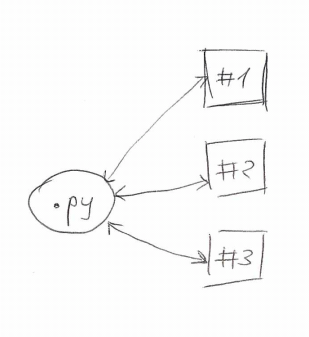
I have a python script which is responsible for a long running migration. The script communicates with three other systems - it reads some data from systems #1 and #2, merges them and then pushes them to the system #3. This is depicted below. The problem was that the migration run at a pace I wasn’t happy with. Since most of the work the script does it communication with external systems I wanted to know which is slow. Python has a great built-in profiler to answer this kind of questions. Follow this post to learn on how to use it.
Profiler
Basic usage is very simple. Say you have myscript.py. To run it with
the profiler, all you need to do is:
$ python -m cProfile -o profile.out myscript.py <other-args>
It’ll run the script and dump the debug data to profile.out. You can
also omit -o profile.out to have the stats dumped to stdout at the
end of the script.
Subprocesses #
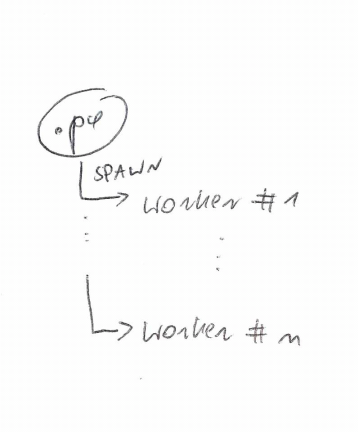
The things are bit more complicated if your script starts any subprocesses. In my case, I was not interested in the main script - all it does is spawning some worker subprocesses. I was interested on what’s going on inside the workers.
Let say your code is similar to this:
import multiprocessing
import time

def worker(num):
    time.sleep(3)
    print 'Worker:', num

if __name__ == '__main__':
    for i in range(5):
        p = multiprocessing.Process(target=worker, args=(i,))
        p.start()
You need to add another layer of indirection:
import multiprocessing
import cProfile
import time

def worker(num):
    time.sleep(3)
    print 'Worker:', num

def profile_worker(num):
    cProfile.runctx('worker(num)', globals(), locals(), 'profile-%d.out' %num)


if __name__ == '__main__':
    for i in range(5):
        p = multiprocessing.Process(target=profile_worker, args=(i,))
        p.start()
And that is it. You’ll have profile-0.out to profile-4.out after
the script is run.
Reading the profile data
If you omit the -o profile.out then you’ll get the stats on
stdout. This is not the perfect solution. It is better to dump the
data and then use runsnake to analyze it.
To install it on ubuntu you need wxpython packages and then you can install it with easy install.
$ sudo apt-get install python-wxgtk2.8 python-wxtools wx2.8-doc wx2.8-examples wx2.8-headers wx2.8-i18n
$ sudo easy-install SquareMap RunSnakeRun
For some reason this was not working for me in virtualenv. I needed a
system-wide easy install. It was complaining on missing module
wx. I’m on ubuntu 12.04.
Then it is simple:
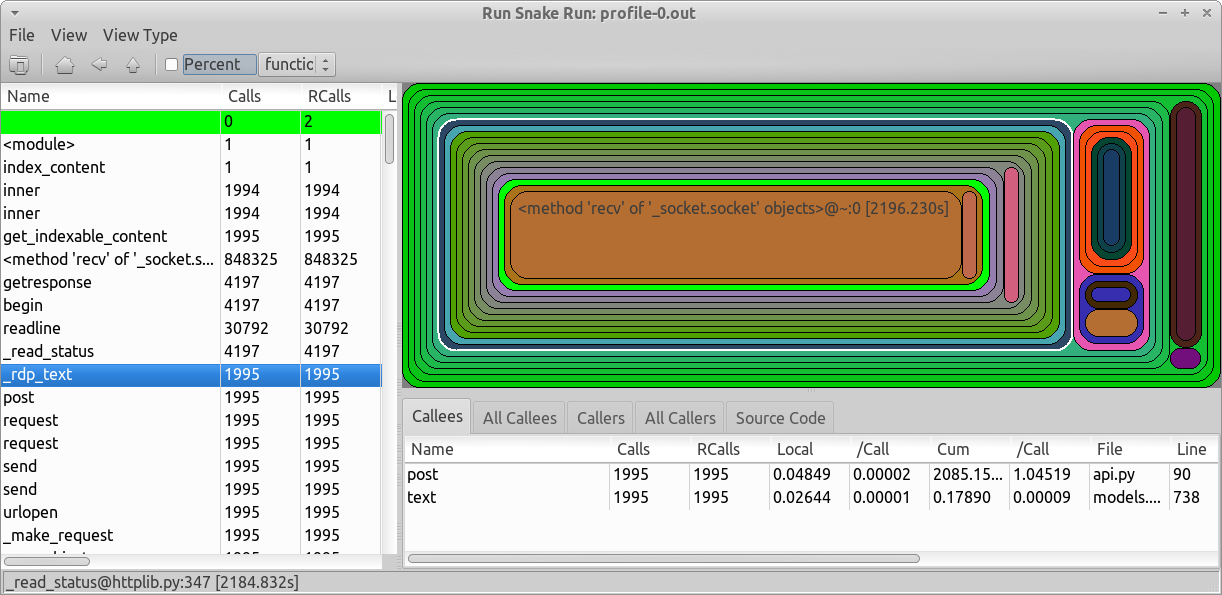
$ runsnake profile.out
You get nice breakdown on different functions, number of calls and cumulative time. This data can tell you a lot about your app. In my case I learned that the communication with one of the systems took 90% of the time. Starting from there I could optimize it.
Sources: