Remote debug your go code
This post has a companion github repo github.com/igor-kupczynski/remote-debug-example – check the repo for a simple example.
Coming to go from the JVM background I often find myself looking for analogs of the features I rely on the JVM ecosystem. One example of such a feature is remote debugging – which is built into JVMs. Read on to find out how to accomplish this in go.
Remote debug #
Remote debug is a very useful feature. You start your application with special options and then you can connect to it with a debugger from your IDE. This is very useful if you want to debug an environmental issue (e.g. that manifests itself only on Google Cloud Platform, or only in QA, but you can’t easily reproduce on your laptop). Maybe even more common nowadays – you may want to debug an application which is running in a docker container.
I’ve recently came across a JetBrains miniseries on developing go apps with GoLand. The second article in the series showed how to remote debug a go binary inside a docker container. The article focuses on GoLand – it’s interface and tools. The concepts are general though. We’ll walk through them here.
Delve – a debugger for go #
In order to allow remote debugging we rely on delve – it is a debugger for go. You need to start delve instead of your binary. Delve will start the target binary for you:
dlv --listen=:40000 --headless=true --api-version=2 --accept-multiclient exec app
--listen=:40000: specifies port to listen,--headless=true --api-version=2 --accept-multiclient: run in a headless mode, specify api version and allow multi client,exec app: execute the go binaryapp.
Build the go binary #
The binary that delve operates on has to be built without optimizations and inlining:
go build -gcflags="all=-N -l"
This means that you probably don’t want to run such a binary in production, unless maybe for the duration of the remote debug session.
Set up the docker container #
Delve starts your binary using ptrace. This means it forks itself and then replaces the forked processed code with the binary. Using the ptrace syscall delve can inspect the memory of the process and control it. This technique violates process isolation and is disabled in the default docker configuration. To allow it we need to add SYS_PTRACE capability to the docker container:
docker run ... --cap-add SYS_PTRACE ...
Note: a few sources online mentioned we need to also relax apparmor settings, but I haven’t found this to be the case. Maybe it depends on the host OS. The argument to docker run is --security-opt="apparmor=unconfined".
We also need to expose the port on which delve waits for a remote debugger to connect:
-p 40000:4000
Putting it all together in a docker compose file (see in the repo):
services:
  example-remote-debug:
    cap_add:
      - SYS_PTRACE
    ports:
      - "8081:8080"    # app port
      - "40000:40000"  # debugger port
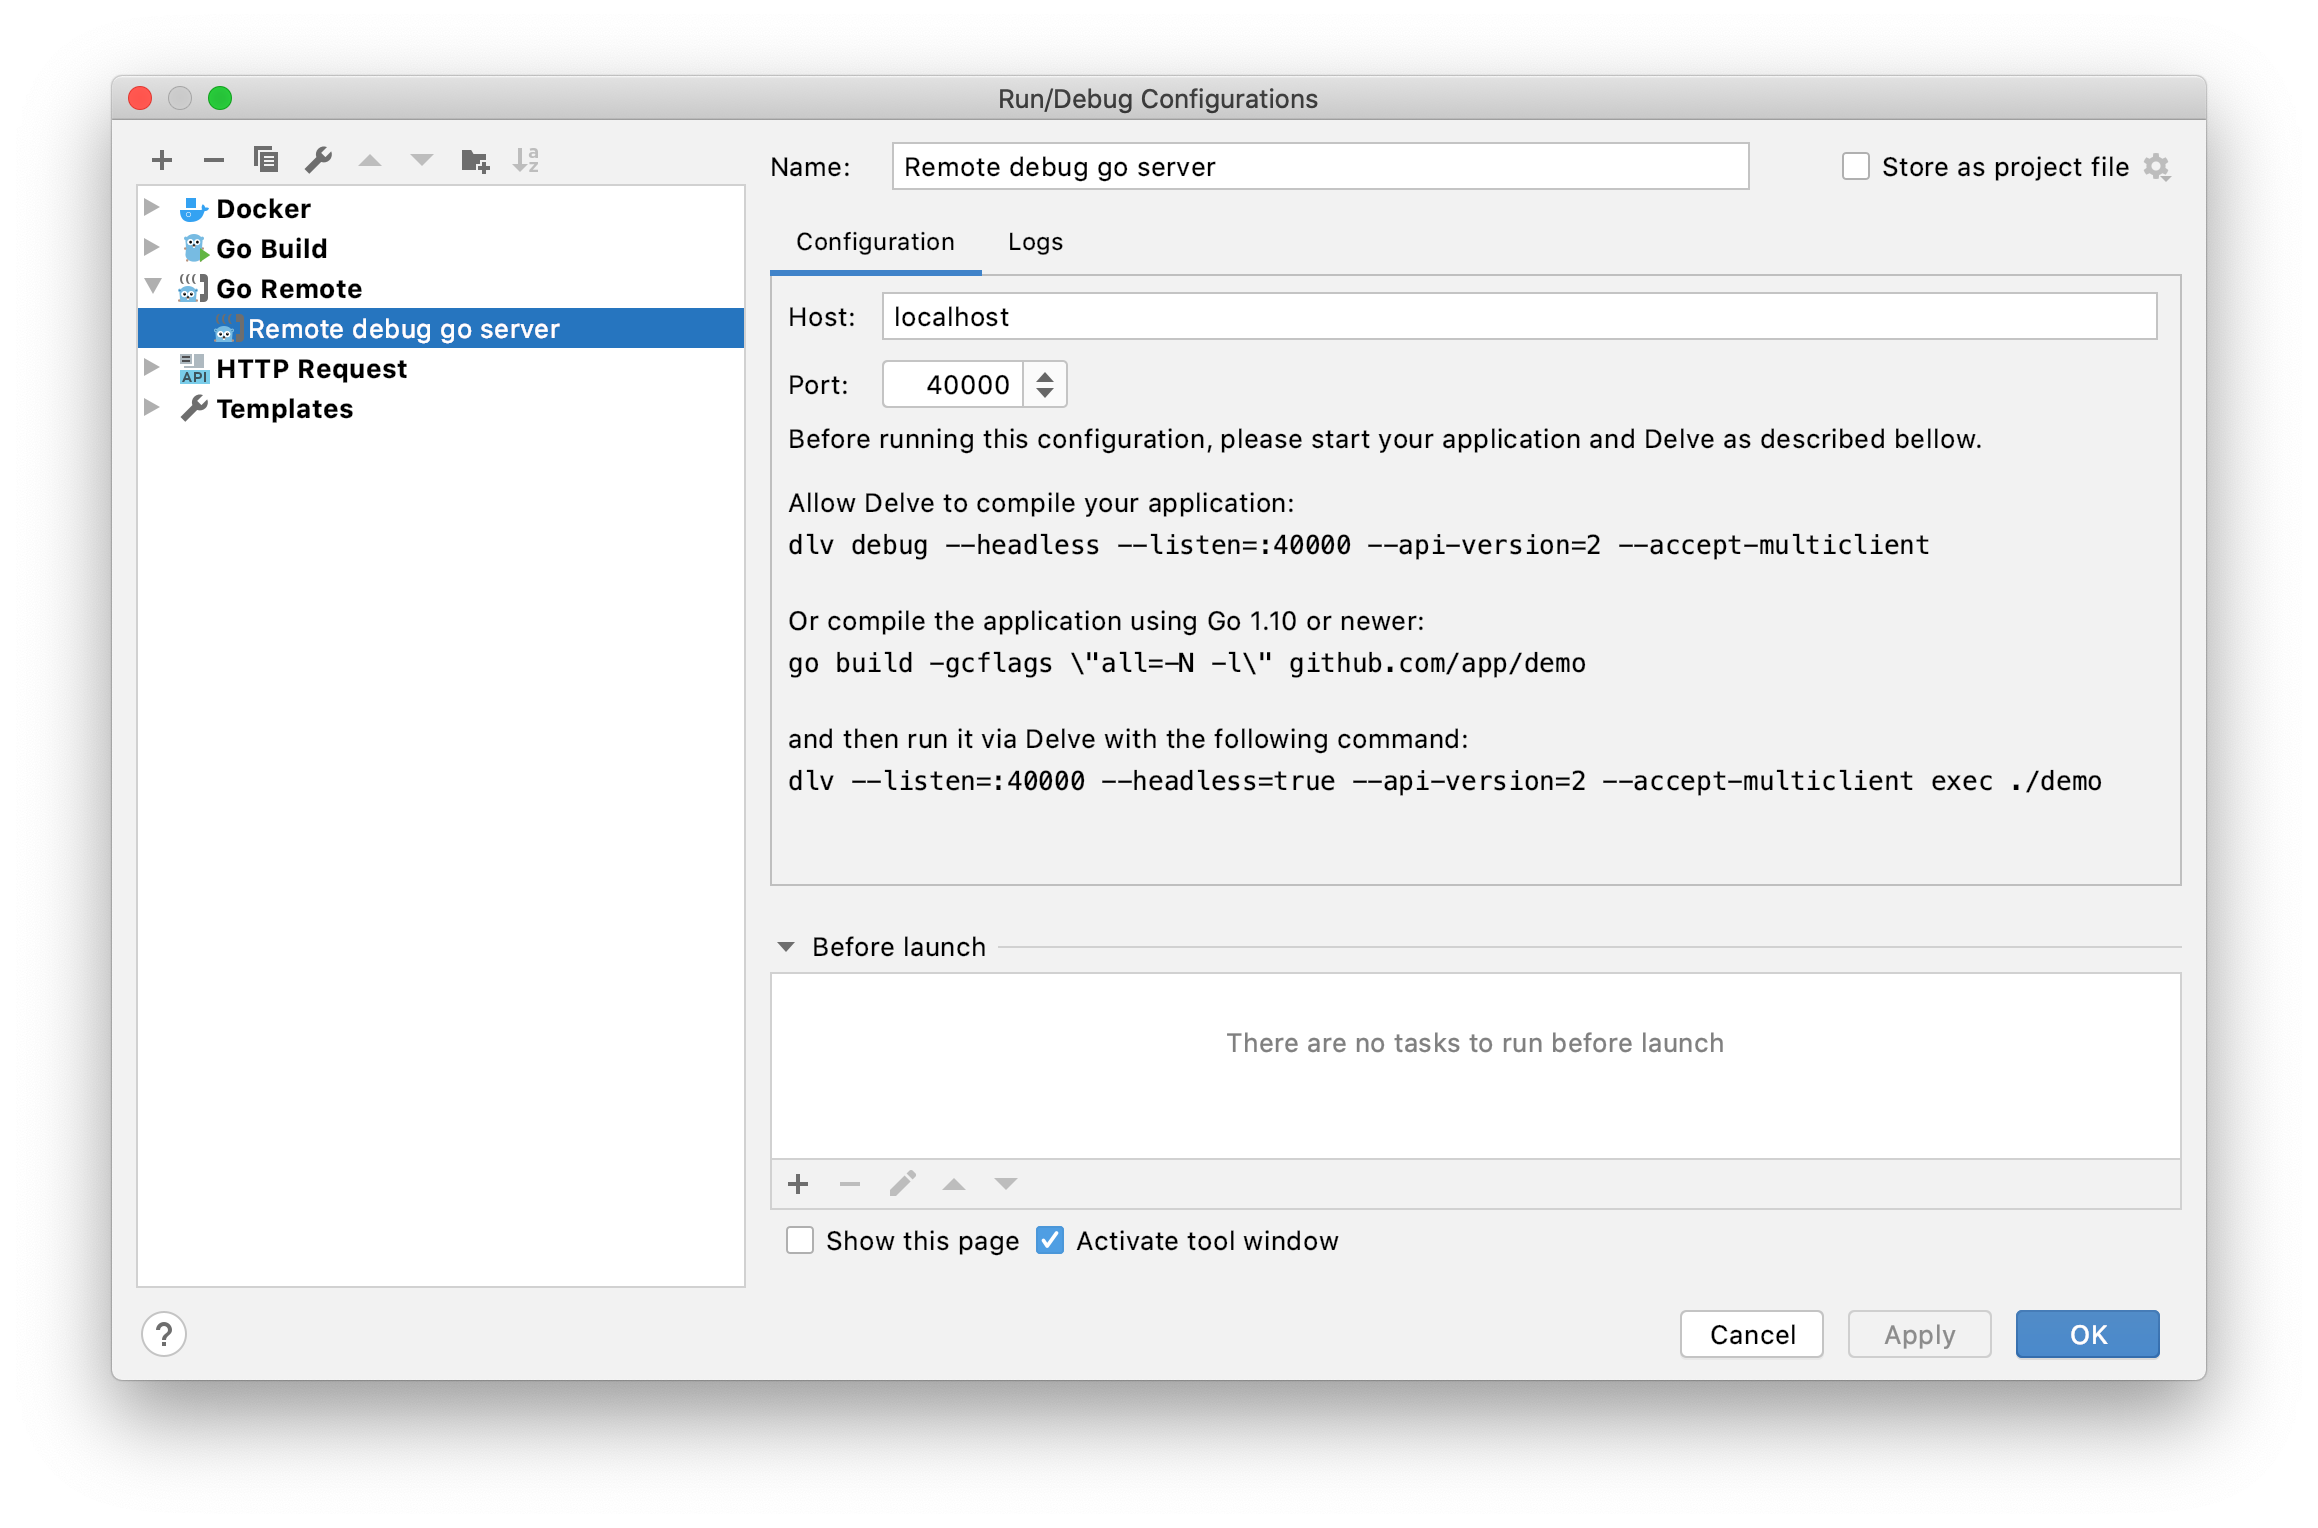
Connect form the IDE #
Delve won’t start your app until you connect to the debugger port. An Intellij example below. VS code configuration is described here.
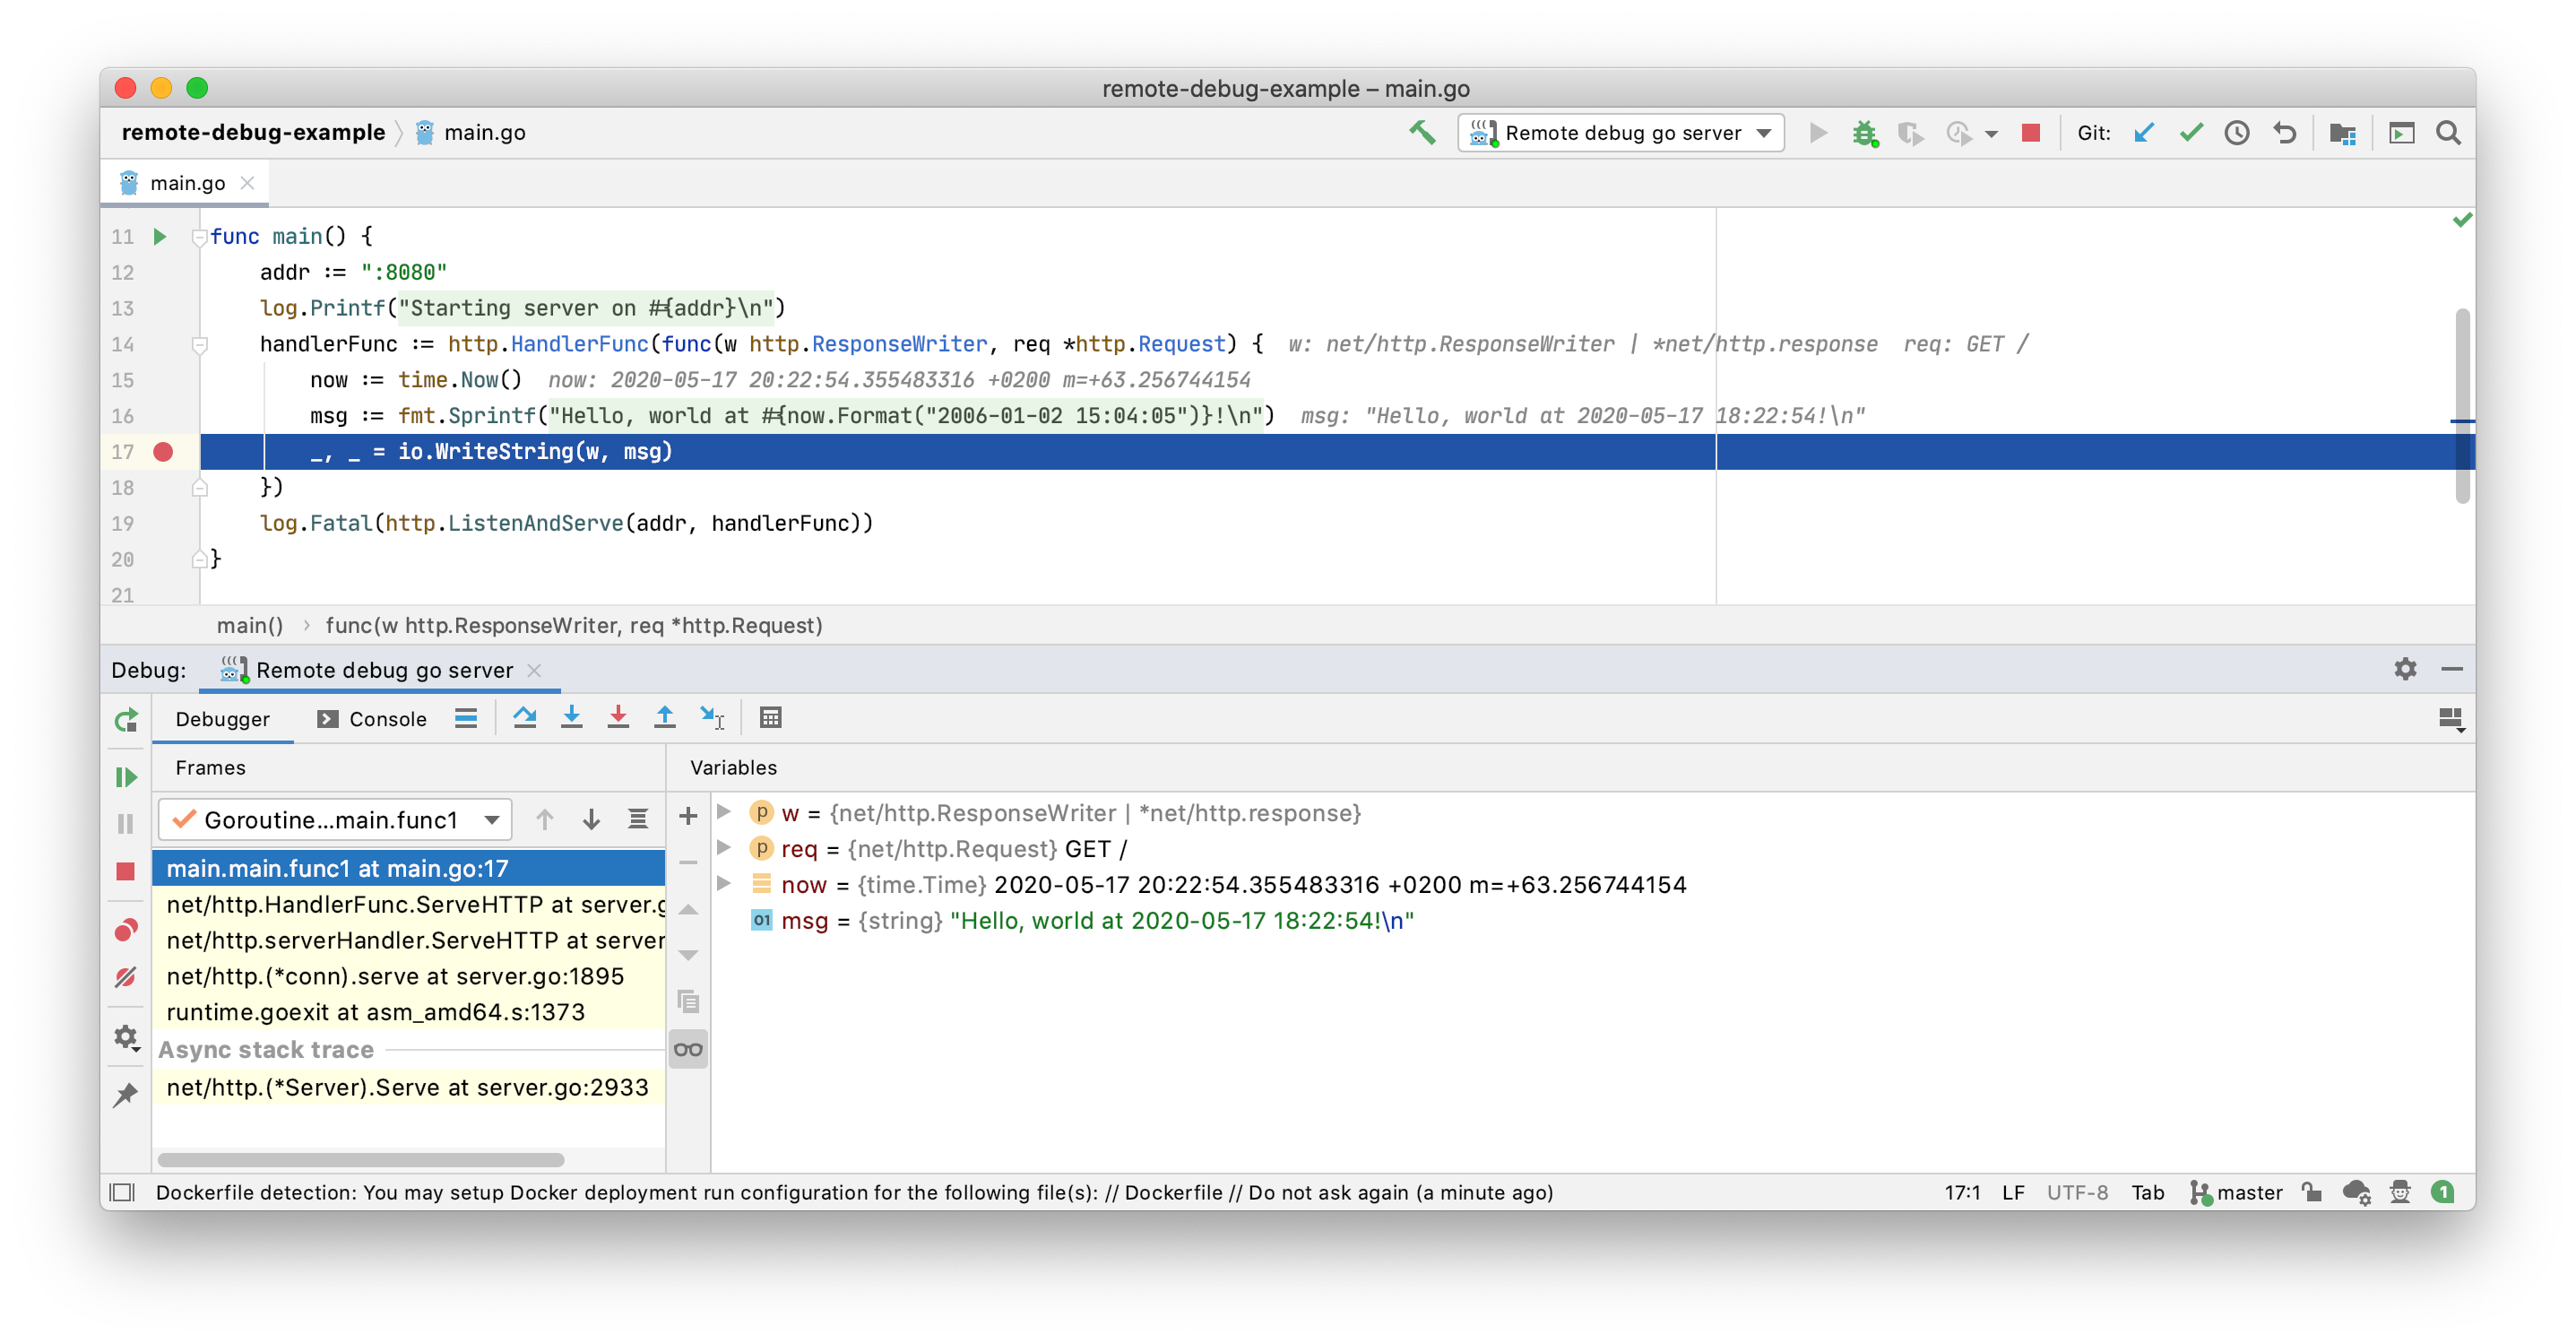
Once you are connected you can set up breakpoints and execute the binary step by step:
Summary #
Being able to remote debug go binaries is a great tool to have in your toolbox. Check the companion repo for a minimal example.